🔍 Exploring Factor Analysis (EFA & CFA) with PsychtrixWeb
Understanding the structure of psychological constructs is at the heart of psychometric research — and Factor Analysis makes this possible.
With PsychtrixWeb, you can perform both Exploratory Factor Analysis (EFA) and Confirmatory Factor Analysis (CFA) quickly and intuitively, transforming your raw data into meaningful insights about the hidden structure of your scales.
🧠 What Is Factor Analysis?
Factor Analysis is a statistical method used to uncover and test the underlying structure (or “factors”) that explain relationships among variables (e.g., test items, survey questions).
- Exploratory Factor Analysis (EFA) helps you discover patterns and potential factor groupings in your data.
- Confirmatory Factor Analysis (CFA) allows you to test whether your data fits a hypothesized structure.
Together, EFA and CFA provide a powerful pathway — from exploration to confirmation — for building valid, reliable psychological instruments.

🧩 Running Exploratory Factor Analysis (EFA) in PsychtrixWeb
EFA is your first step in understanding how your items group together to measure latent constructs such as intelligence, personality, or attitude.
Step-by-Step Guide:
- Navigate to:
Validity Analysis → Exploratory Factor Analysis - Select Your Dataset:
Choose your uploaded dataset (minimum 3 variables required). - Choose Variables:
Select the items you want to include in the factor analysis. - Set the Number of Factors to Extract:
You can specify how many latent dimensions (factors) you expect. - Select Extraction Method:
- PCA (Principal Components Analysis): Fastest method, good for exploration
- PAF (Principal Axis Factoring): Recommended for true factor analysis
- ML (Maximum Likelihood): Best for inference and model testing
- Choose Rotation Method:
- Varimax (Orthogonal): Assumes factors are uncorrelated
- Promax (Oblique): Allows factors to be correlated (recommended for psychological constructs)
- Click “Run EFA”
PsychtrixWeb will process your data and display results with clear visuals and tables.
📊 Interpreting EFA Results
KMO (Kaiser-Meyer-Olkin)
Indicates sampling adequacy — how suitable your data is for factor analysis.
| KMO Value | Interpretation |
| ≥ 0.90 | Marvelous |
| ≥ 0.80 | Meritorious |
| ≥ 0.70 | Middling |
| ≥ 0.60 | Mediocre (minimum acceptable) |
| < 0.60 | Unacceptable |
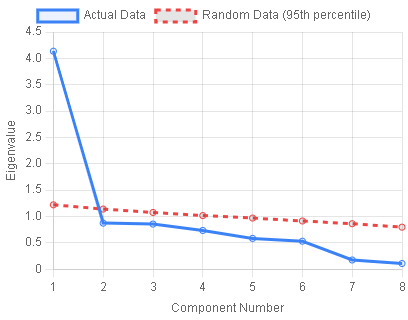
Scree Plot & Parallel Analysis
These tools help determine the optimal number of factors:
- Scree Plot: Look for the “elbow” point where eigenvalues start to level off.
- Parallel Analysis: Retain factors where actual eigenvalues exceed those from random data.
- Kaiser Criterion: Keep factors with eigenvalues > 1.0.
Factor Loadings
Show how strongly each item relates to its factor.
| Loading Value | Interpretation |
| ≥ 0.70 | Excellent (explains 50% variance) |
| ≥ 0.40 | Acceptable |
| < 0.40 | Weak — consider removing |
| Cross-loadings | Avoid items loading highly on multiple factors |
Communalities (h²)
Represent the proportion of variance explained by the extracted factors.
| h² Value | Interpretation |
| ≥ 0.60 | Good representation |
| ≥ 0.40 | Acceptable |
| < 0.40 | Poor representation — consider revising variable |
🔬 Running Confirmatory Factor Analysis (CFA) in PsychtrixWeb
Once you’ve explored the structure with EFA, it’s time to test it formally using CFA.
Step-by-Step Guide:
- Navigate to:
Validity Analysis → Confirmatory Factor Analysis - Select Your Dataset
Choose the same or a refined dataset for testing. - Build Your Model:
- Click “Add Factor” to create latent constructs (e.g., Anxiety, Depression).
- Name each factor and assign observed indicators (items).
- Each factor needs at least 2 indicators (3+ recommended).
- Click “Run CFA”
PsychtrixWeb will estimate the model and generate detailed fit indices and path diagrams.
📈 Understanding CFA Fit Indices
| Fit Index | Description | Interpretation |
| CFI (Comparative Fit Index) | Compares model to baseline | ≥ 0.95 = Excellent, ≥ 0.90 = Good, ≥ 0.85 = Acceptable |
| RMSEA (Root Mean Square Error) | Adjusted absolute fit measure | ≤ 0.05 = Excellent, ≤ 0.08 = Good, ≤ 0.10 = Acceptable |
| SRMR (Standardized Root Mean Square Residual) | Average standardized residual | ≤ 0.05 = Excellent, ≤ 0.08 = Good |
| TLI (Tucker-Lewis Index) | Penalizes model complexity | ≥ 0.95 = Excellent, ≥ 0.90 = Good |
💡 Tip: Always check the 90% confidence interval for RMSEA and report it for transparency.
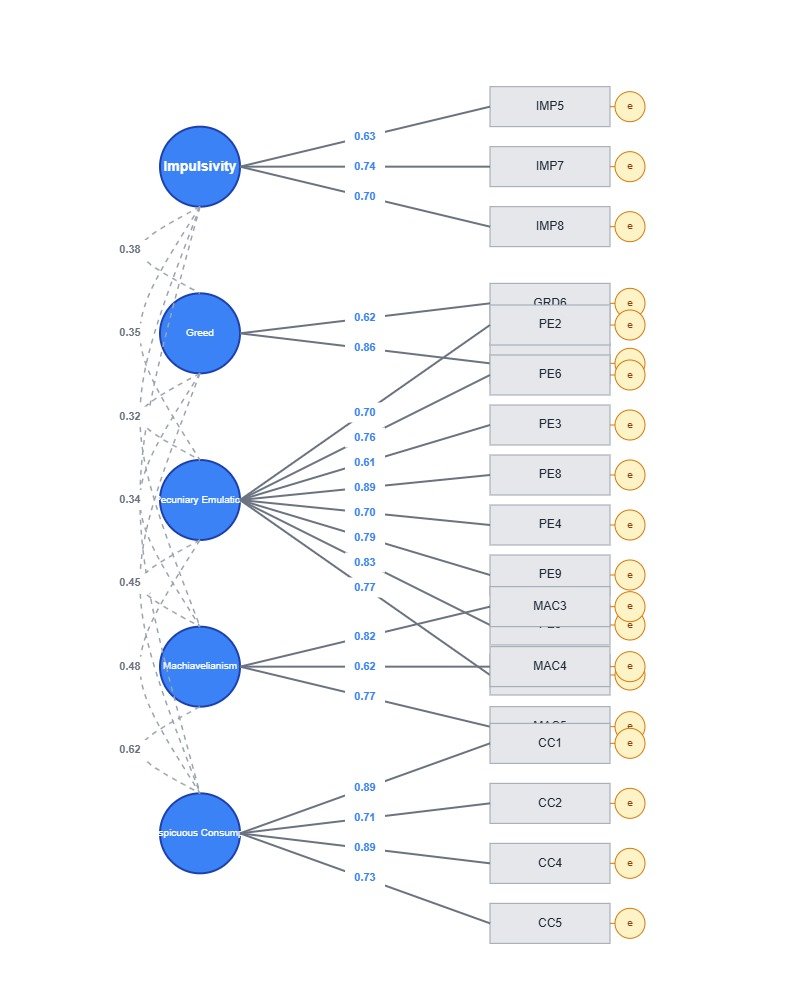
🧭 Path Diagram Visualization
PsychtrixWeb automatically generates a clear path diagram showing your model:
- 🔵 Blue circles: Latent factors (unobserved constructs)
- ⚫ Gray rectangles: Observed indicators (items)
- 🟡 Yellow circles: Error terms
- ➡️ Arrows: Factor loadings (standardized values)
- 🔄 Curved lines: Correlations between factors
- ✅ Green loadings: Statistically significant (p < .001)
💡 Pro Tip: Export the path diagram as PNG — perfect for journal submissions, theses, or presentations.
🧠 Modification Indices (MI)
PsychtrixWeb also displays Modification Indices (MI) to suggest possible improvements — but interpret them carefully:
- MI > 3.84: Suggests statistically significant improvement possible
- EPC (Expected Parameter Change): Shows how much improvement freeing the parameter would bring
⚠️ Only make theory-driven changes. Avoid post-hoc model searching and always cross-validate with an independent sample.
💾 Export Options
PsychtrixWeb allows you to export your complete reports and visuals:
EFA Exports:
- Scree Plot (PNG)
- Parallel Analysis (PNG)
- Full Report (TXT)
CFA Exports:
- Path Diagram (PNG)
- Full Report (TXT)
- All Fit Indices
📚 Recommended Workflow
To get the best from your analysis, follow this research workflow:
- Run EFA to identify the underlying factor structure.
- Use Scree Plot and Parallel Analysis to determine the number of factors.
- Review factor loadings and communalities.
- Build your CFA model based on EFA results.
- Evaluate fit indices (CFI, RMSEA, SRMR, TLI).
- Inspect modification indices for theory-driven refinements.
- Export your reports and path diagrams for publication or documentation.
🚀 Why PsychtrixWeb?
With PsychtrixWeb, you can conduct EFA and CFA analyses in a user-friendly, visual, and statistically sound environment.
✅ No coding required
✅ Real-time visualizations
✅ AI-supported recommendations
✅ Professional report exports
✅ Secure browser-based workflow
From discovering hidden constructs to validating theoretical models, PsychtrixWeb brings professional-grade psychometrics to your fingertips.
🌟 Final Thoughts
Factor Analysis is the backbone of test validation, helping you uncover the true structure behind your data.
With PsychtrixWeb, you can move confidently from exploration (EFA) to confirmation (CFA) — all in one elegant platform.
👉 Try it today at PsychtrixWeb and experience the future of psychometric intelligence.